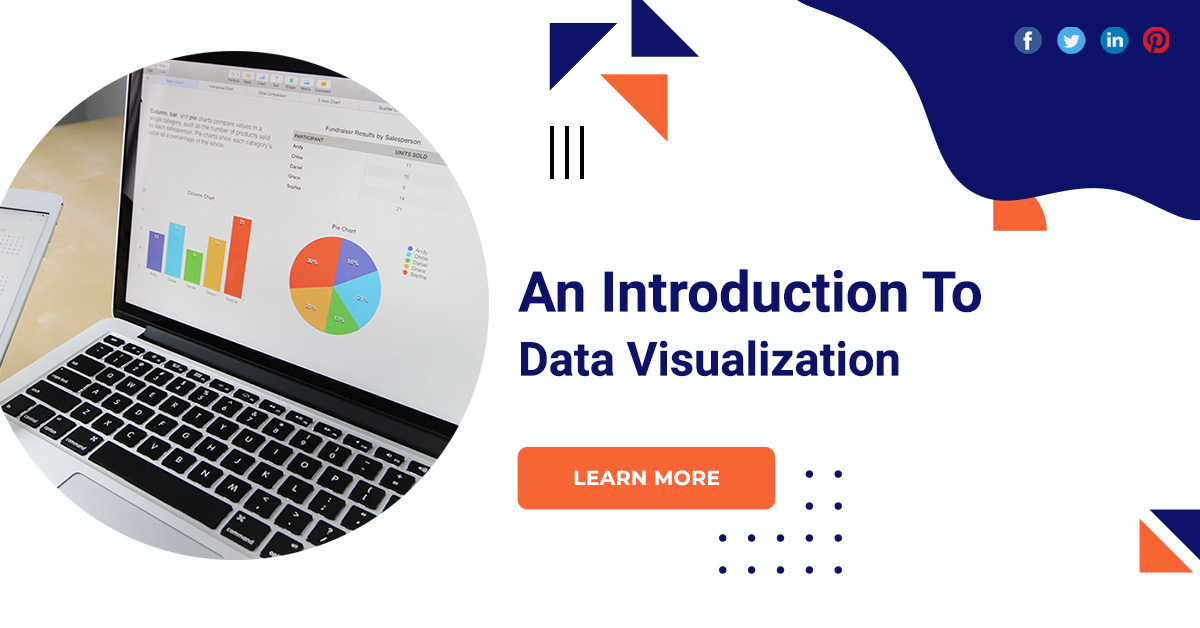
An Introduction To Data Visualization
Using visual elements such as tables, graphs, and maps, data visualization tools provide an accessible way to see and understand trends, outliers, and patterns in data. In addition, it provides an excellent way for employees or business owners to present data to a non-technical audience without confusion.
Data visualization
C-level executives
The CEO can track all of the company’s metrics using the tools without having to review every team. The CFO can see all financial metrics in a single dashboard. Other executives can use data visualizations as KPI dashboards in their meetings.
Sales teams
Sales managers can track sales and deals closed by each employee. They can also use to help motivate the team to reach their quota.
Marketing teams
Marketers can track open rates and impressions of email and ad campaigns. They can also use tools to more easily analyze interactions with customers and prospects.
Customer service teams
Call centers can visualize the number of calls received along with the average waiting time and calls. The help desk can also better track resolved tickets.
Data analysis software
Data analytics software can analyze massive amounts of data at incredible speed, but how can it explain the results of that analysis? Today, the only way to do this is graphics. Story generation software can run as a plug-in to dashboards. Tools like Savvy are installed on the server and allow each user of the dashboard to get a written summary of the demand.
What is data visualization?
Data visualization is a graphical representation of any data or information. Visuals such as tables, graphs, and maps are just a few the tools that provide viewers with an easy and accessible way to understand the information represented.
Data visualization with tableau
Tableau is an American data visualization company that easily connects to almost any data source; it can be either an enterprise data warehouse, Microsoft Excel or web data. Data also doesn’t need to be collected because Tableau enables real-time analysis on the data source. Tableau allows you to connect to various data sources, files, and servers.
Conclusion
To conclude our brief study on data visualization, it is clear that the field is rich with potential applications in various disciplines, and at the same time we must be aware of its practical and ethical complexities.


